
You are here: Start » Programming Reference » Testing and Debugging
Testing and Debugging
This article expands on the information given in Running and Analysing Programs.
Execution and Performance
FabImage Studio allows the user to debug and prototype their applications. It employs many features that help the user with designing and testing the program.
Those features are enabled by default, which makes FabImage Studio behave different than FabImage Runtime. Differences can affect both performance and program flow. As such, those settings are not recommended when testing how the final version works.
Performance-Affecting Settings
There are two settings that affect the performance in a noticeable way. The first one is the Diagnostic Mode.
Many filters have diagnostic outputs and when the Diagnostic Mode is on, those outputs will be populated with additional data that may help during program designing.
However, calculating and storing this additional data takes time. Depending on the program, this can cause a considerable slowdown.
This mode can be toggled off with the ![]() button
in the Application toolbar.
button
in the Application toolbar.
Another setting that can hinder the performance compared to FabImage Runtime is Previews Update Mode. Ports that are being previewed are updated according to this setting. Updating previews is generally quite fast, but it depends on the amount and complexity of the data being previewed (large instances of Image or Surface will take more time to display than an instance of Integer).
With active previews even having the filter visible in the Program Editor will cause some overhead (tied to how often the filter is executed). This is related to how FabImage Studio shows progress. The option Program » Previews Update Mode » Disable Visualization disables the previews altogether. While the overhead is generally small it can be noticeable when the iteration of the program is also short.
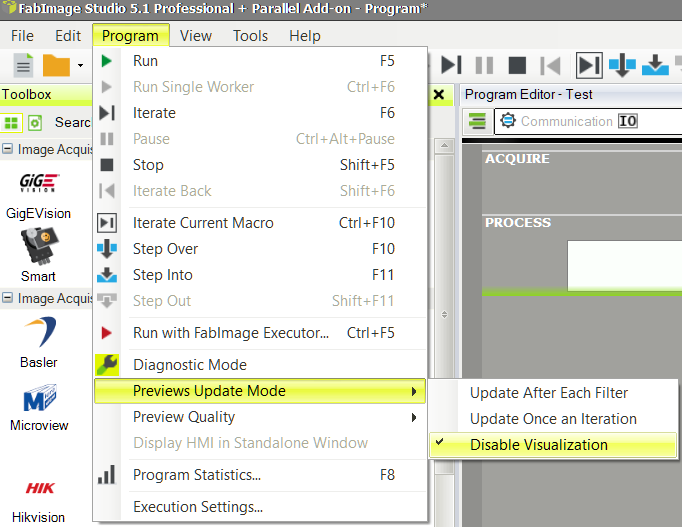
Location of the option to disable visualization
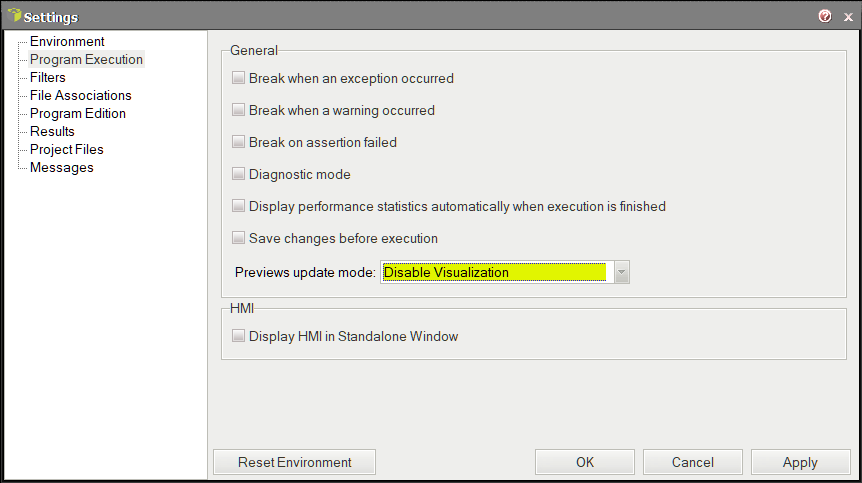
Both settings can also be changed in Program Execution settings.
Disabling the Diagnostic Mode along with previews makes Studio execute programs nearly as fast as Runtime.
Execution Flow
There is one more difference between Studio and Runtime execution. By default, Studio is set to pause whenever an exception, warning or assertion occurs.
Every exception will cause the program to pause, even if it is handled with an error handling.
Runtime continues to run through all of them, when possible - it will only report them in the console.
To make Studio behave like Runtime in that regard, the following settings need to be disabled:
- Break when an exception occurred
- Note that this does not prevent errors from ending the program. This can only be achieved with error handling.
- Break when a warning occurred
- Break on assertion failed
At any point during testing it is possible to view statistics ![]() of every filter executed until this point.
of every filter executed until this point.
Operation Mode
There are two modes in which the program can be run during debugging: normal and iteration mode.
- In normal mode, the program will run continuously until the user pauses it or until it ends. In this mode, previews are updated according to the Previews Update Mode setting
- During iteration mode, the user can step into macrofilters, step over them or step to the end of macrofilters or iterate the displayed macrofilters.
Both modes will also pause whenever they encounter one of the things described in the following part.
Execution Pausing
The following can pause the application. The application will pause at any of these regardless of the mode in which it was launched:
- Breakpoints,
- Ending of the tracked Worker Task,
- Failed Assertions (can be changed in settings),
- Exception (can be changed in settings),
- Warnings (can be changed in settings).
The program can also be stopped at any time using the pause![]() button.
button.
Breakpoints
Breakpoints allow the user to specify points in the program at which the execution will pause. They are effective only in Studio.
- Breakpoints can be placed at any filter or output block by right-clicking and selecting Toggle Breakpoint, by pressing F9 or by hovering on the left side of the Program Editor.
- Breakpoints are saved in the project and they will still be present after loading the program again. To remove them it is necessary to select Edit » Remove All Breakpoints option.
- Breakpoints are shared between all instances of particular macrofilters that contain them. For example, if there are two instances of TestMacro, with a breakpoint inside, the program will pause both when executing the first and the second one.
- Breakpoints can be placed in HMI events.
- Breakpoints affect all Worker threads.
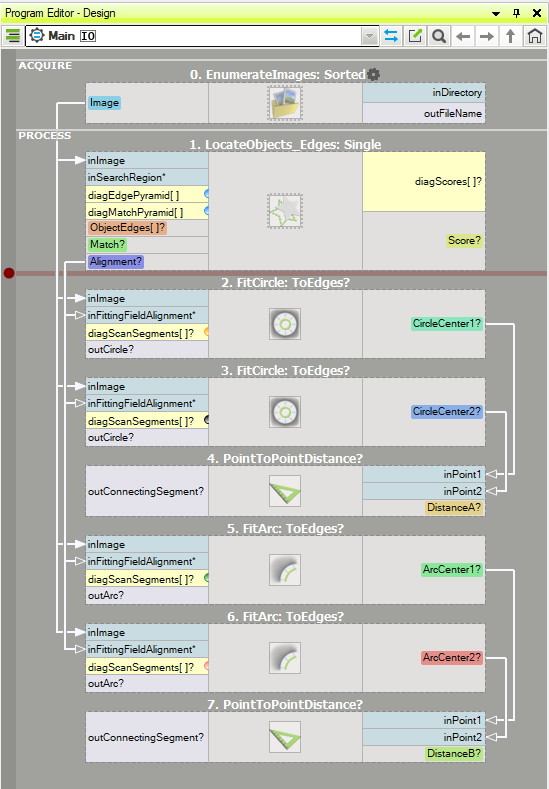
A view of a macrofilter in which a breakpoint was placed.
Single-Threaded Debugging and Testing
An application that features only one Worker Task is a common design pattern. After starting such an application it will run continuously until it ends or is paused.
You can start the application in iteration mode. This will start at the beginning of the application in Main.
Both modes of operation can be used during one run. For example, you can start in the normal mode until a breakpoint, continue in the iteration mode and finish back in the normal mode.
The third way to start the program is to right-click a filter and select Run Until Here. The program will start in the normal mode until the specified point and then pause.
- Unlike breakpoints, the point specified this way is unique. The program will pause only in the specified instance of the macrofilters, even if there are different instances in the program.
HMI events can also be debugged. Breakpoints can be placed inside event handling macrofilters and the program will pause correctly. Ports in events can be connected to previews. However, it is not possible to use the option Run Until Here in events.
It is possible to preview values of ports from different Worker Tasks or HMI events. They will be updated according to the relevant setting.
Multi-Threaded Debugging and Testing
To run in Studio programs with more than one Worker Task it is necessary to own also a Parallel Add-on license. If there are multiple Worker Tasks in application that use data analysis tools, then it is necessary to have some multi-threaded runtime license to deploy it. Tools belonging to modules others than following ones which can be used without restrictions: FoundationLite, Genicam, ThirdParty and OpenCV. List of all macrofilters using data analysis tools can be check on Licensing tab of Program Statistics tool in Studio.
Application with multiple Worker Tasks introduces new concepts. First of them is the Primary Worker Task. It is the Task macrofilter that controls the duration of the program. When the Primary Worker Task ends, the other Worker Tasks end as well, even if they were still running.
Conversely, the program will continue running as long as that Worker Task is running, even if other Worker Tasks have ended. The primary Worker Task is selected by the user and cannot be changed while the program is running. To select a Worker Task macrofilter as the Primary Worker Task macrofilter, you can right-click it and choose Set as Primary Worker or select it in the ComboBox in the toolbar when the program is not running.
The second concept is Tracked Task. This is the Task that is actively tracked, i.e. it is possible to run it in the iteration mode and its call-stack is visible at the bottom. When the program is paused (for any reason mentioned above) FabImage Studio will automatically make the Worker Task in which the pause happened the Tracked Task. It is also possible to manually change tracked Worker Task - either by right-clicking it and selecting Track This Worker or by selecting it in the ComboBox when the program is paused.
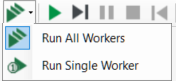
When the program has multiple Worker Tasks, another elements is shown in the toolbar, to the left of the Run button.
It functions as a ComboBox and allows the user to change the behavior of the Run button between executing all Worker Tasks or only the Primary Worker Task.
button.
It functions as a ComboBox and allows the user to change the behavior of the Run button between executing all Worker Tasks or only the Primary Worker Task.
It is only possible to switch it before the program is started. When the program is paused, all Worker Tasks are paused.
When in the iteration mode only one Worker Task is being run, it is the Tracked Worker. The other Worker Tasks are paused, so if the they exchange information that is important for debugging, the normal mode has to be used at some point.
If the program is started in the iteration mode, the Worker Task that is being viewed at the moment (or that contains the macrofilter being viewed) will be set as the Tracked Worker Task and only this thread will run. At any point, you can run it in normal mode to launch the remaining threads.
The Primary Worker Task is marked with an asterisk attached directly to its name, visible when the program is running. The active Worker Task is emboldened both when the program is off and when it is running.
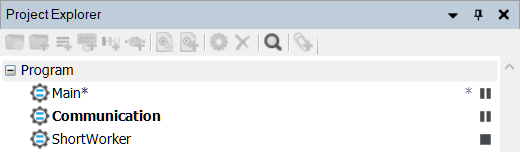
A view of the Project Explorer of a paused program. The Main Worker Task, which is the Primary Worker Task is marked with an asterisk attached to its name (not to be confused with the asterisk on the right, related to thread consumption). The currently Tracked Worker Task Communication is bold. The ShortWorker has already ended, which is marked with a stop symbol, as opposed to the pause symbol.
Program ComboBox
The ComboBox in the Toolbar allows the user to specify both the Primary Worker Task and the Tracked Worker Task. It can also display active threads. Its functionality changes depending on the state of the program.
When the program has not run or has stopped, the ComboBox selects the Primary Worker. It is one of two ways of setting the Primary Worker (the other being through right-clicking the desired Worker Task).
When the program has been started and is paused, the ComboBox displays all active threads at the moment. This includes HMI events, if the pause happened when an event was being executed. All Worker Tasks that have already ended will not be displayed. The user can set one of the Worker Tasks active in the ComboBox as the Worker Task to be tracked.
Iterating Program
Running the program in the iteration mode can be achieved with the buttons present in the Application Toolbar. As mentioned before iterating actions are single-threaded. All Worker Tasks other than the tracked one will be paused when iterating.
Additional information about iterating can be found in Running and Analysing Programs.
Iterate Program
The Iterate Program![]() button executes one iteration of the Primary Worker Task.
button executes one iteration of the Primary Worker Task.
Iterate Current Macro
Iterate Current Macro![]() launches
the program and then pauses it as soon as one iteration of the visible macrofilter instance has finished.
launches
the program and then pauses it as soon as one iteration of the visible macrofilter instance has finished.
Iterate Back
Under some circumstances it is possible to Iterate Back![]() , that is to reverse the iteration and go back to the previous data. The requirements for this option are:
, that is to reverse the iteration and go back to the previous data. The requirements for this option are:
- The program has to be paused after completing one iteration of a filter (either with Iterate Current Macro
 or
Iterate Program
or
Iterate Program ).
).
- The filter has to be a Task or Worker Task.
- The filter has to be the Primary Worker Task or be inside it.
- The Task macrofilter to be iterated back cannot contain other Task macrofilters.
- At least one of the loop generators in the task needs to be deterministic and be a source of data (for example it has to be an enumeration filter). Some examples include:
Filters such as EnumerateImages and EnumerateFiles create a list of objects before their first iteration and enumerate over it. The list will not reflect later changes to the list (adding/removing images or files).
As long as the Task contains at least one enumeration filter is present it is possible to iterate back. Furthermore, there can be other loop generators present, even if they are not enumerators.
Below are examples of filters that do not allow iterating back by themselves:
- Camera grabbing filters, such as GenICam_GrabImage.
- Loop — no data to iterate back.
- Communication filters, such as TcpIp_ReadLine.
If those filters are in a Task that can be iterated back, they will behave as they would during a normal, non-reversed iteration.
Step Buttons
There are three options for the user to move step-by-step through the program. Those are: Step Over![]() , Step Into
, Step Into![]() , and Step Out
, and Step Out![]() .
.
Those buttons are described here.
Iterating Options Conclusion
The following table is describing all iterating options in a concise manner:
| Method | Primary Worker | Tracked Worker | Number of workers run | Can be used inside HMI events |
|---|---|---|---|---|
Run( ) )Normal Mode |
Primary Worker | All | Yes | |
Run( ) )Normal Mode |
Primary Worker | (Tracked Worker) |
Yes | |
| Run Until Here (Context menu option) |
The worker in which the option was selected | All | No | |
Steps   |
The worker in which the option was selected | (Tracked Worker) |
(when event is tracked) |
|
| Iterate Program |
(Primary Worker) |
No | ||
| Iterate Current Macro |
(Tracked Worker) |
No |
| Previous: Formulas | Next: Error Handling |