You are here: Start » Getting Started » First Program: Simple Blob Analysis
First Program: Simple Blob Analysis
This article demonstrates the basic workflow in FabImage Studio with an example of simple blob analysis. The task here is to separate nails from other objects which are present in the input image.
Extracting Blobs
To start this simple demonstration we load an image from a file – with the LoadImage filter (tool), which is available in the Image Acquisition section of the Toolbox, the From File group. The image used in the example has been acquired with a backlight, so it is easy to separate its foreground from the background simply with the ThresholdToRegion filter (Image Processing → Threshold Image). The result of this filter is a Region, i.e. a compressed binary image or a set of pixel locations that correspond to the foreground objects. The next step is to transform this single region into an array (a list) of regions depicting individual objects. This is done with the SplitRegionIntoBlobs filter (Region Analysis → Split Region):
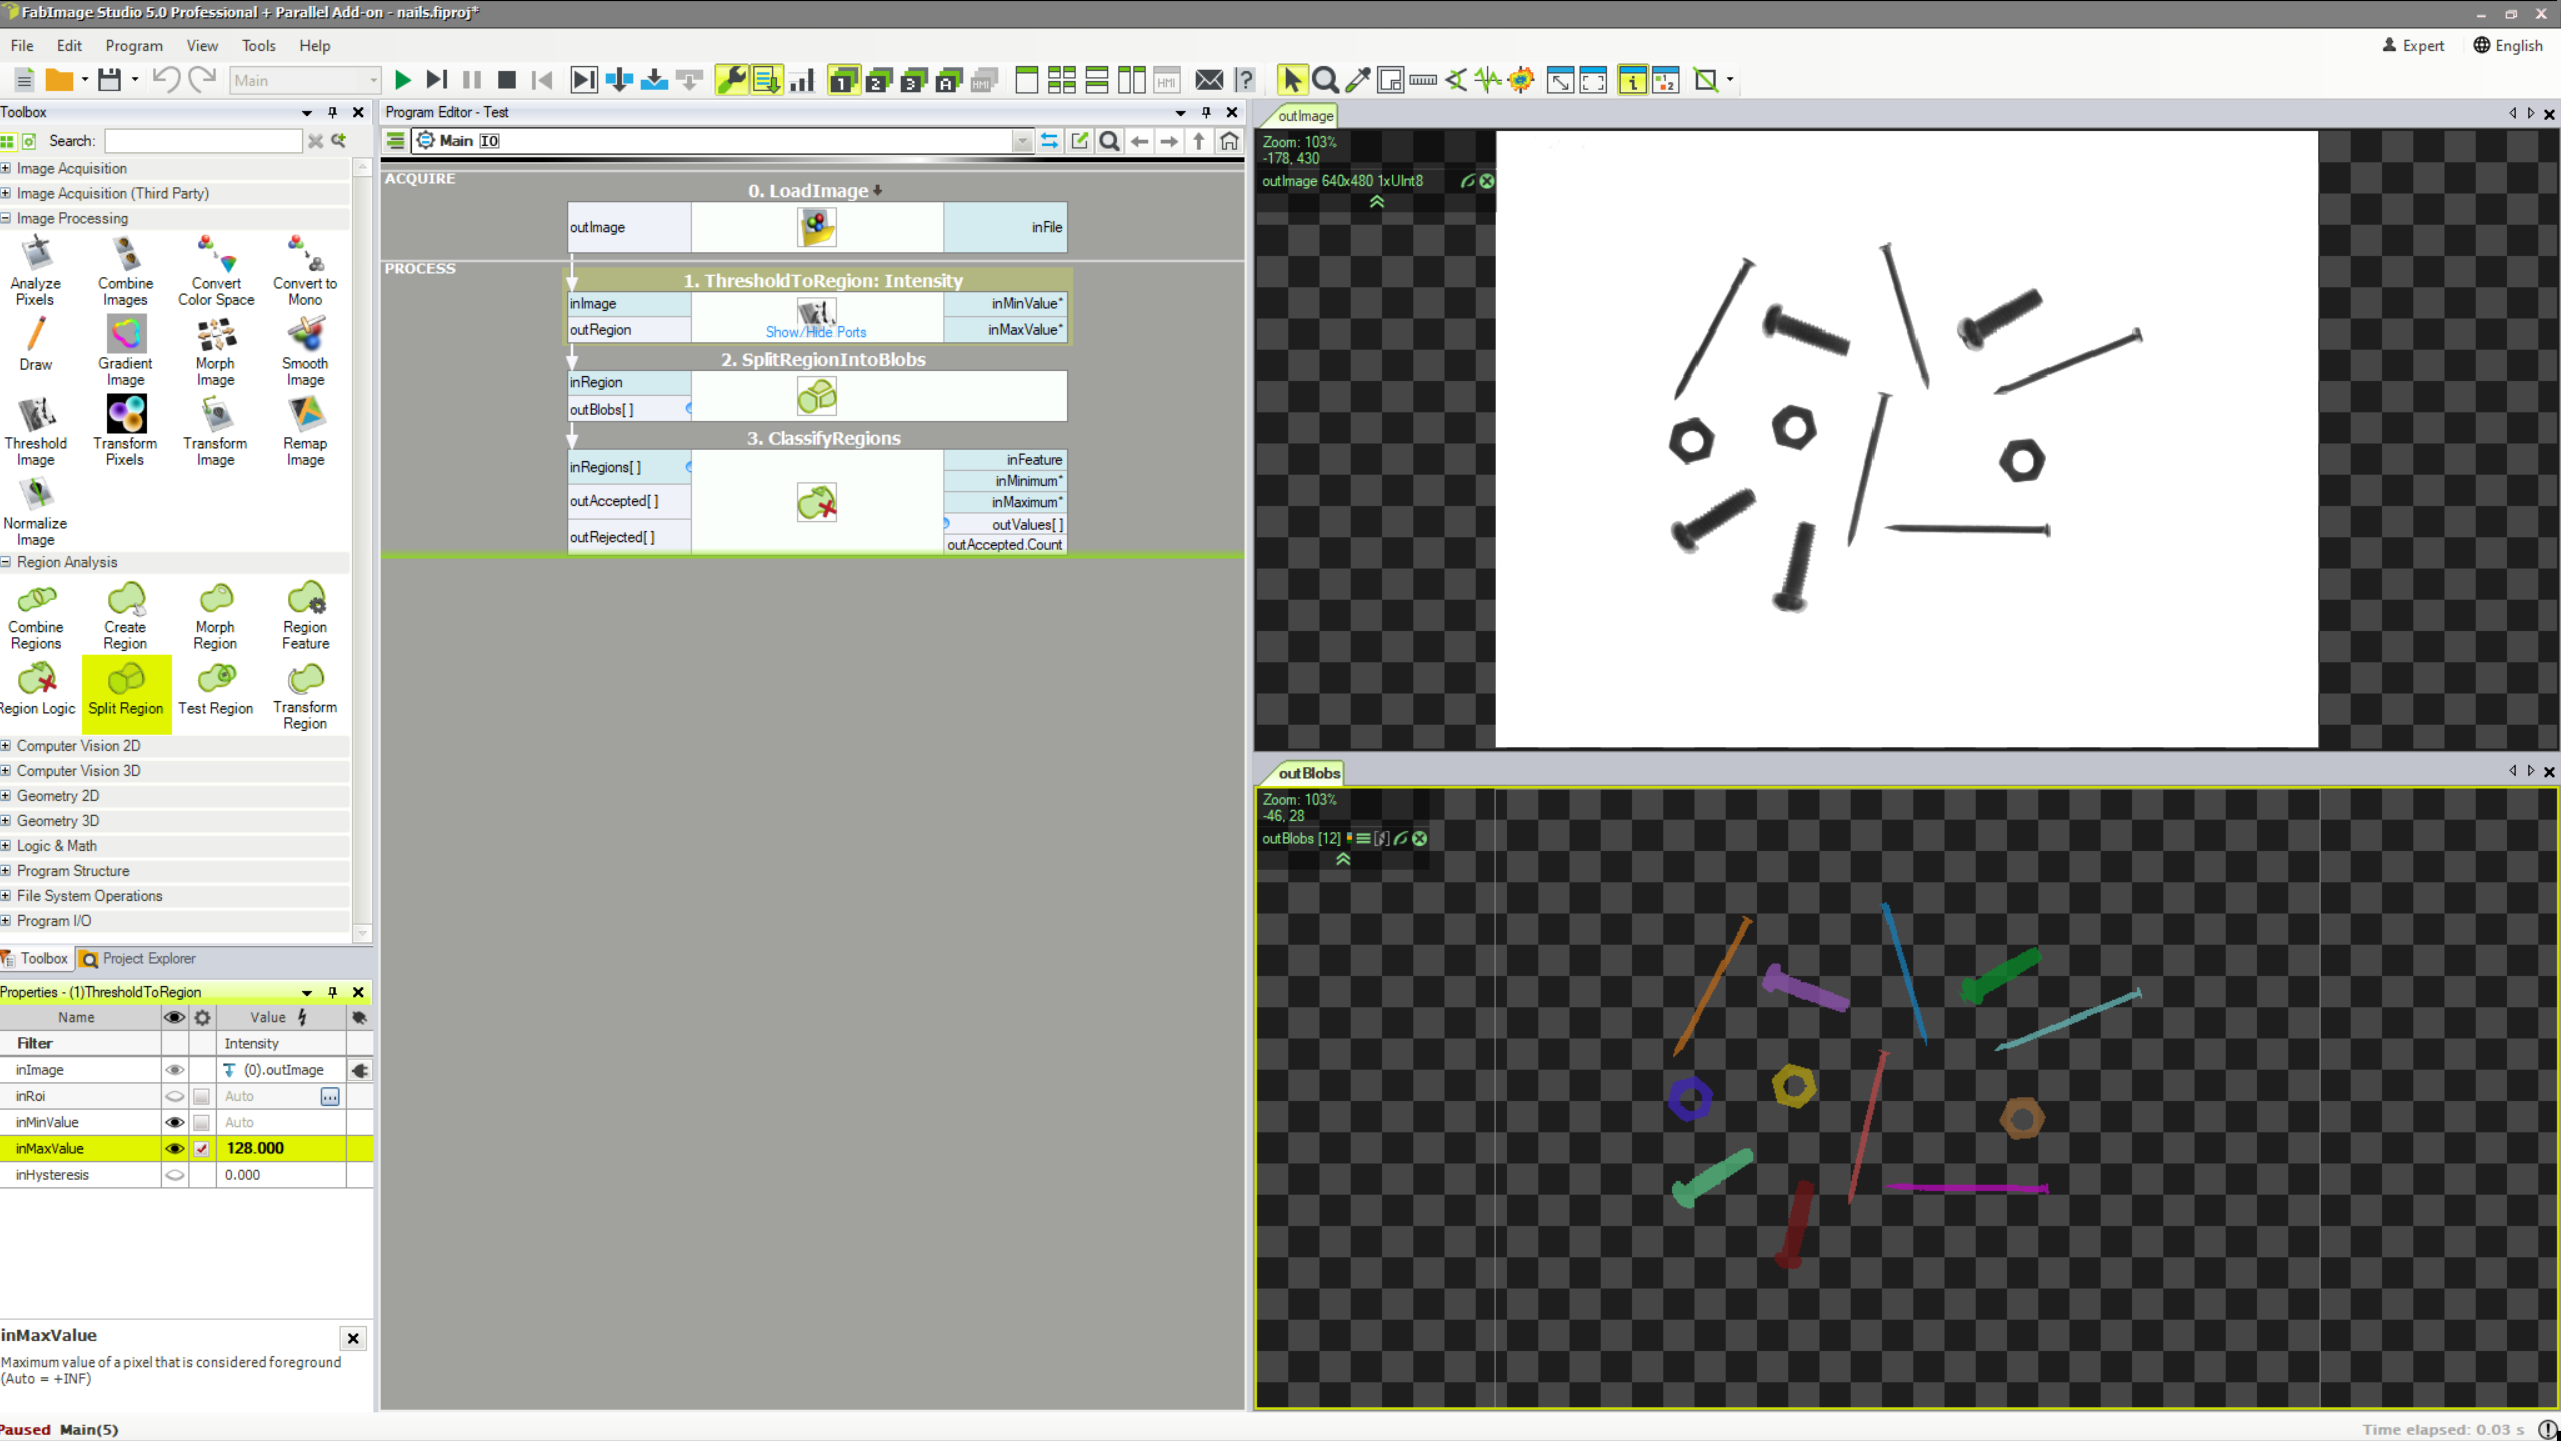
Extracting blobs from an image.
Notes:
- Connections between filters are created by dragging with a mouse from a filter output to an input of another filter.
- The data previews on the right are created by dragging and dropping filter outputs.
- The input file is available here: parts.png.
Classifying the Blobs
At this stage what we have is an array of regions. This array has 12 elements, of which 4 are nails. To separate the nails from other objects, we can use the fact that they are longer and thinner. The ClassifyRegions filter (Region Analysis → Region Logic) with inFeature input set to Elongation and inMinimum set to 10 will return only the nails on its outAccepted output:
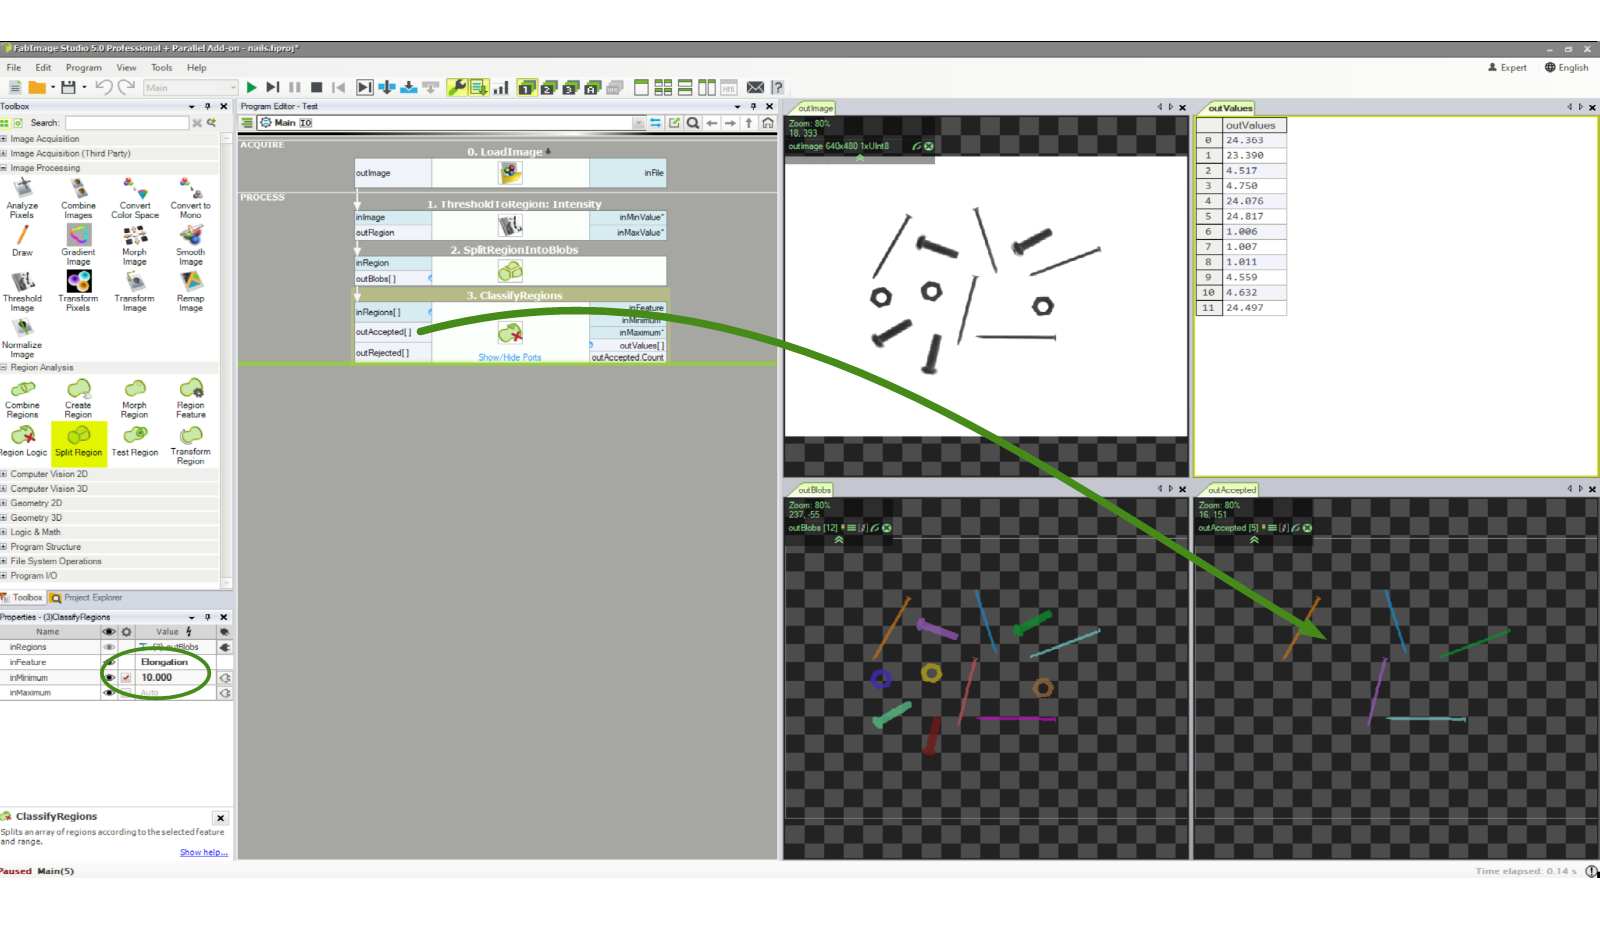
Classifying blobs by the "elongation" feature.
There is also the outValues output which contains the feature values of the individual blobs. This can also be displayed in the Data Previews as a table of real numbers. The indexes in this table correspond to the blobs, which can be shown by using the "Show Indexes of Elements" option in the selected data preview toolbar:
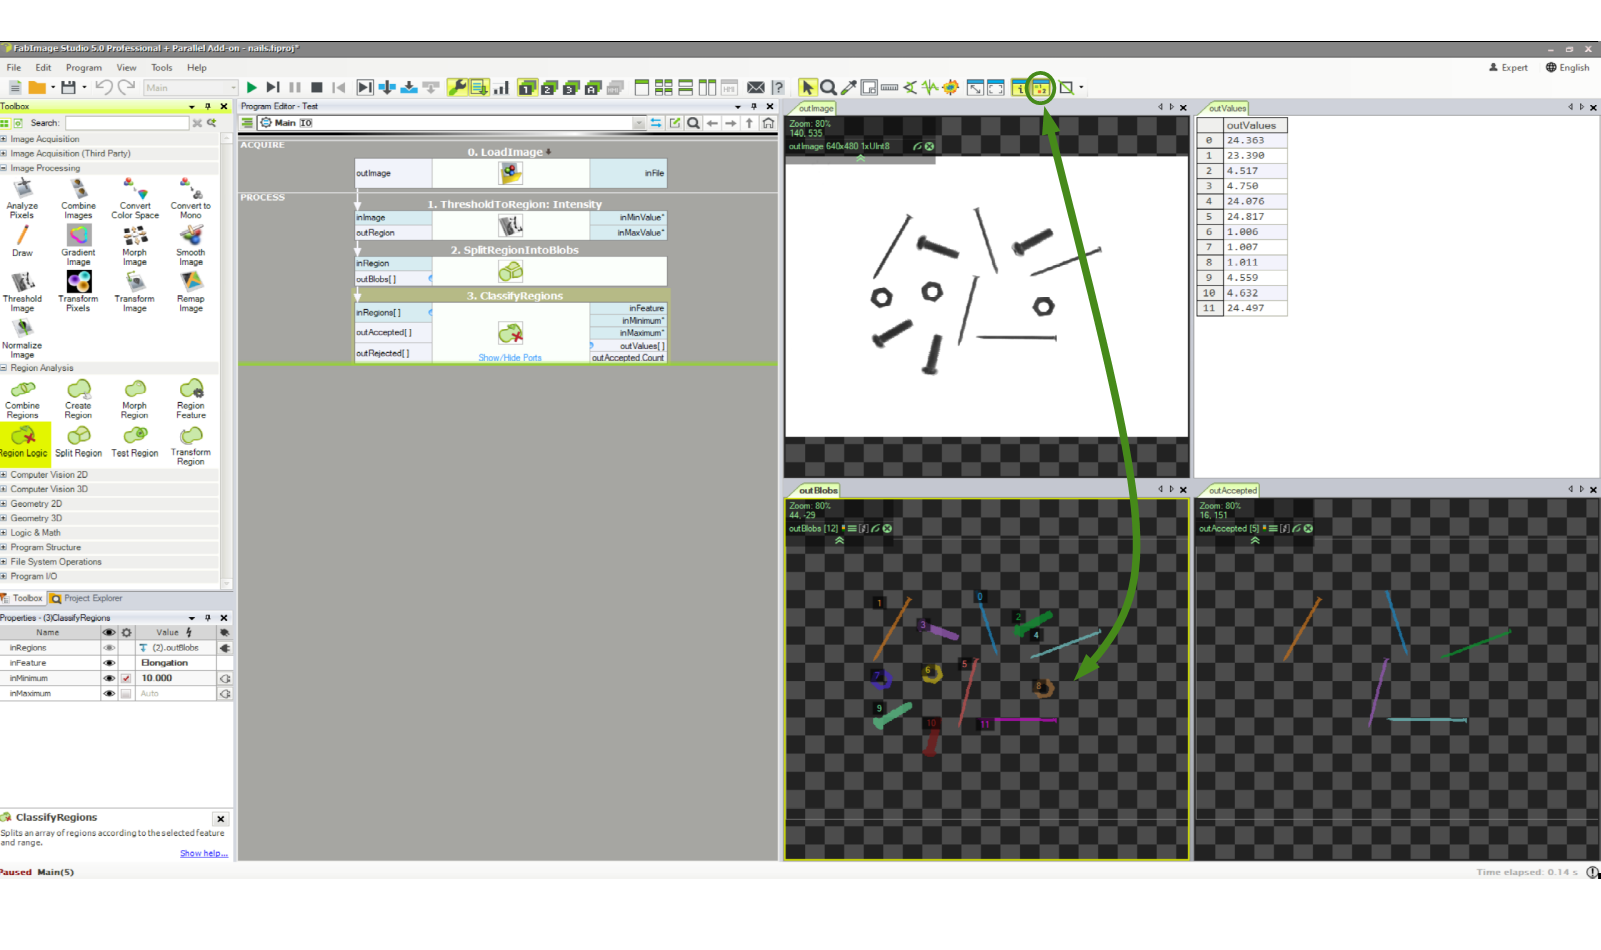
Showing indexes of individual blobs.
Drawing the Results
Finally, we can create an output image (e.g. for displaying in the HMI) with the nails marked in green. For this purpose we use the DrawRegions_SingleColor filter, which needs to have its inImage and inRegions inputs appropriately connected. The inColor input defines the required color and can be edited through the Properties window.
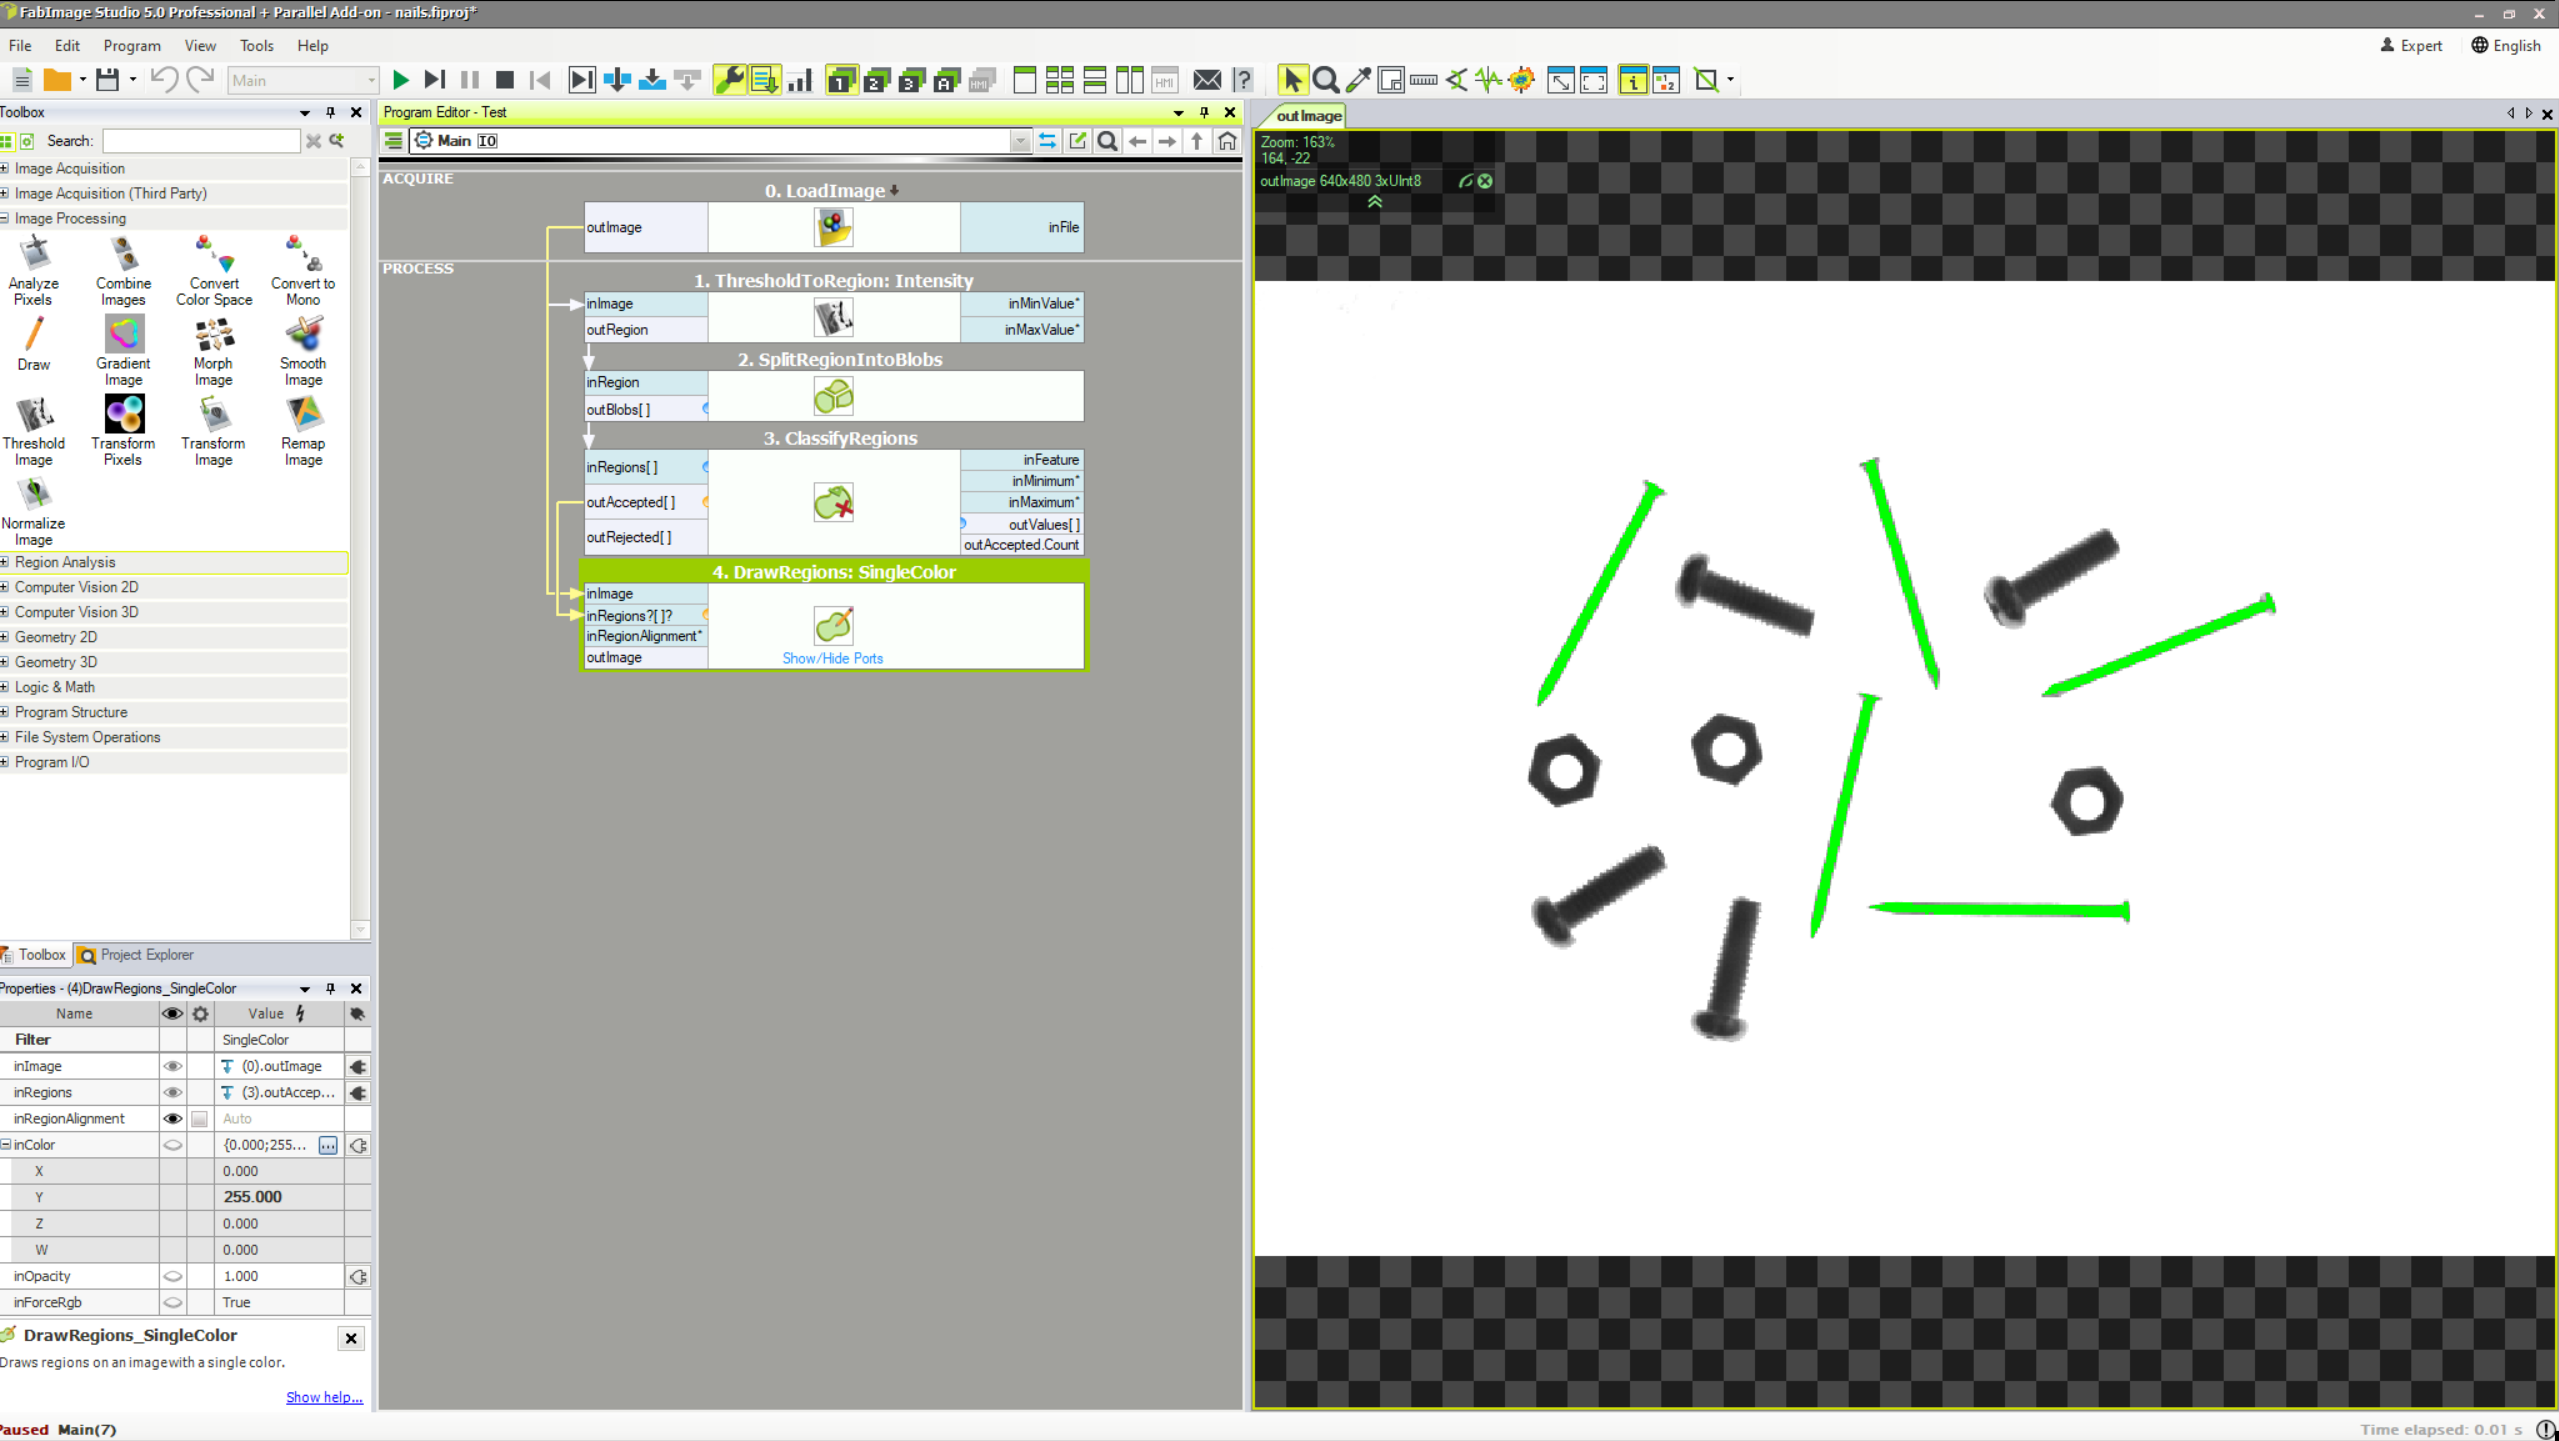
Drawing the nails in green.
Getting the Number of Elements
If we want to obtain also the number of elements found, we can right-click on the outAccepted output and select Property Outputs → Count, which creates an additional output named outAccepted.Count. In this case we are getting the number 5:
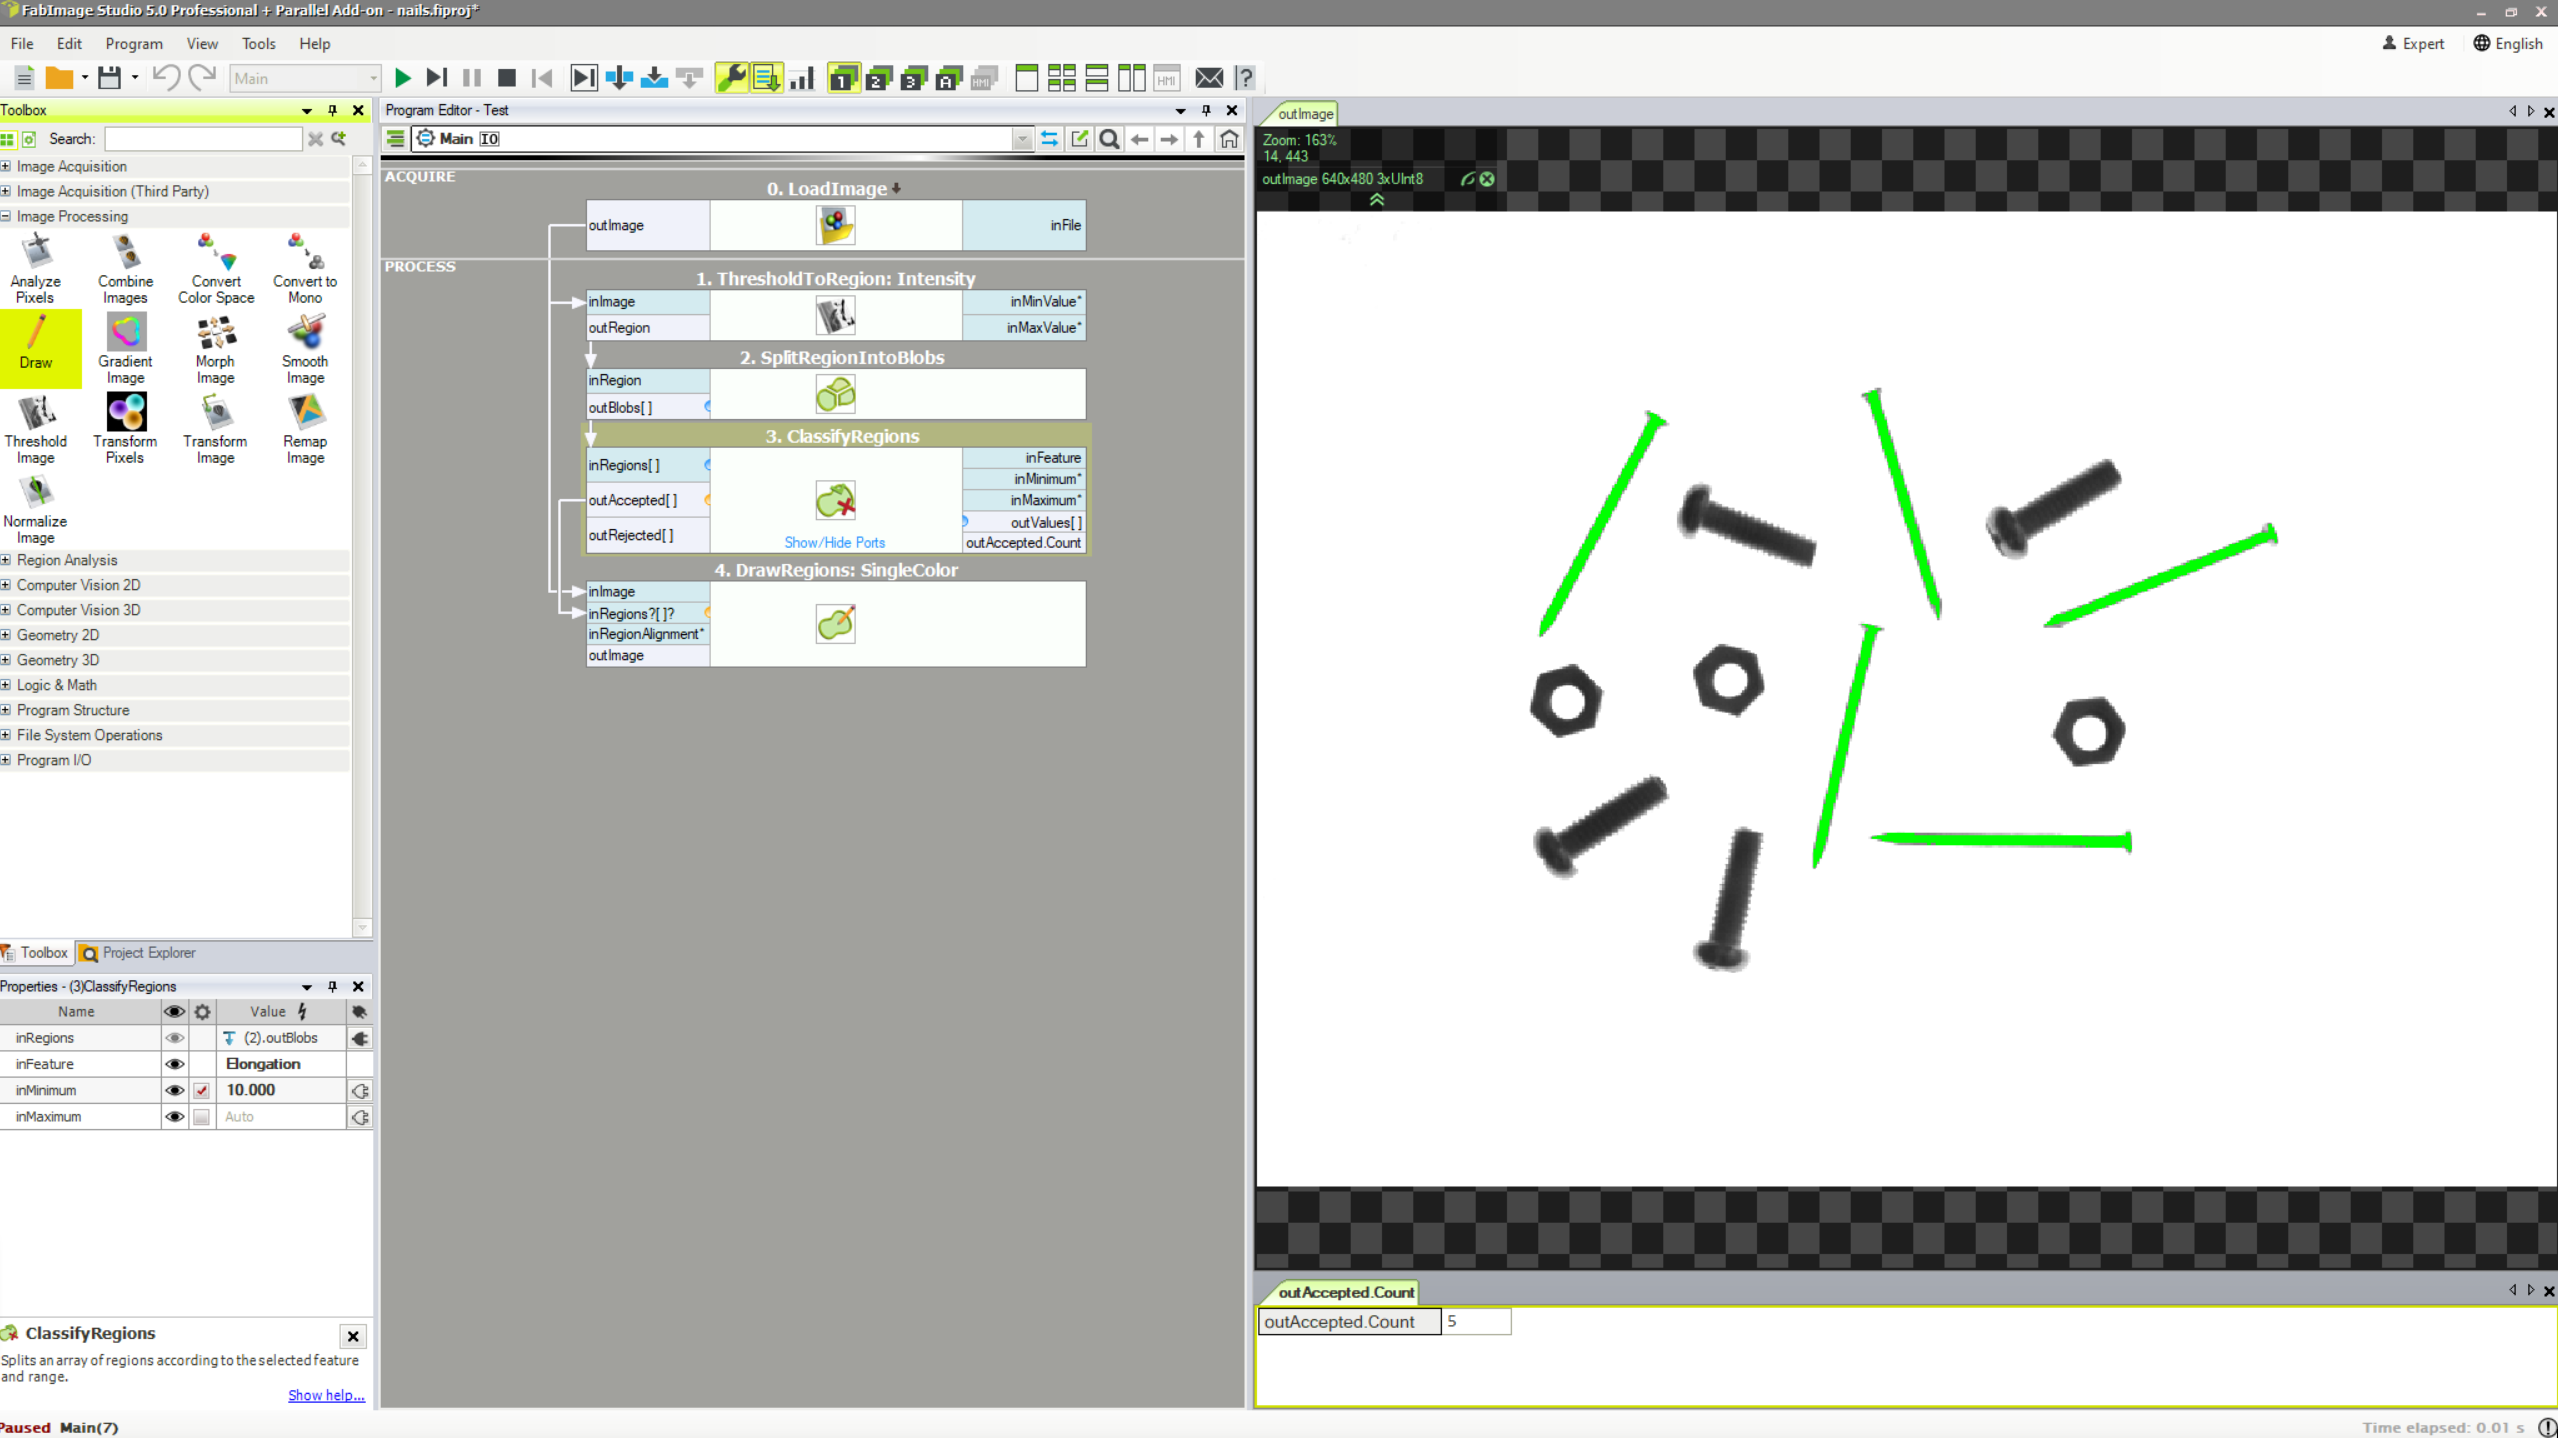
Counting the found objects.
Conclusion
As this example demonstrates, creating programs in FabImage Studio consists of selecting filters (tools) from the Toolbox (or from the Filter Catalog), connecting them and configuring. Data previews are created by dragging and dropping filter ports to the data preview area. This simple workflow is common for the most basic programs, as the one just shown, as well as for highly advanced industrial applications which can contain multiple image sources, hundreds of filters and arbitrarily complex data-flow logic.
Note: This program is available as "Nails Screws and Nuts" in the official examples of FabImage Studio.
| Previous: Preview and Data Presenting | Next: User Interface |
