You are here:
Start »
Tutorial Exercises »
Generating Plots (formulas)
Generating Plots (formulas)
Aim
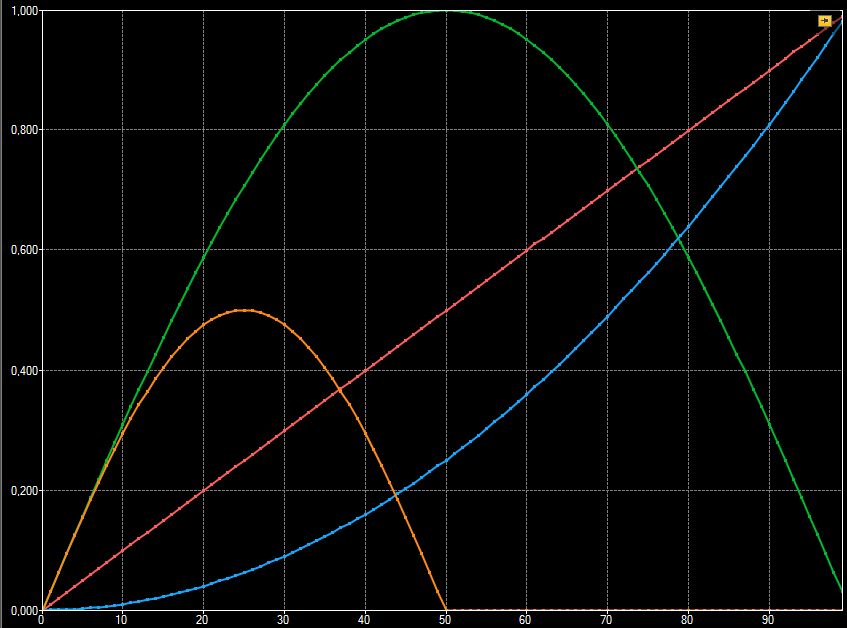
Create an application that creates plots for the following mathematical functions:
- Linear function: y=x
- Sine function: y=sin(180 * x)
- Quadratic function: y=x * x
- Threshold function that returns value 0.5 * sin(x * 360) if x is smaller than 0.5, otherwise it returns 0.
Function arguments should be provided as Real values.
Input
The defined parameter range.
Output
Created plots should be presented using a single preview window.

Hints
Use Formulas to calculate function values.
CreateRealSequence filter should be used o create series of real values in a specified range.
Use RealArrayToProfile filter to create a profile that can be used to present a function's plot.
Labeling connections is explained in this article.
Solution (FIS)
►Click here to show the solution.
▼Click here to hide the solution.
-
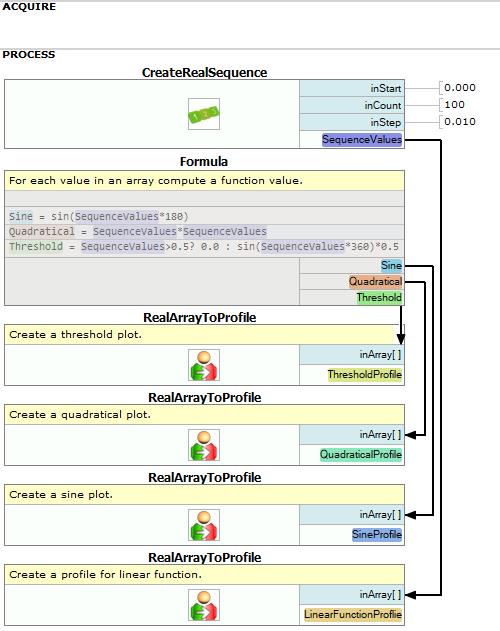
Add CreateRealSequence filter to the project and set inCount to 100 and
inStep to 0.01. This filter creates an array of real values that will be used as function arguments. Label outValues output as SequenceValues. You can use that label as an argument in the formula later or. It does not have to be connected to the formula.
-
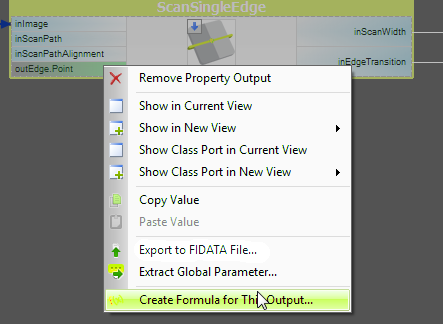
Add Empty formula to the program. Formula can be easily created by right clicking on the Program Editor Window:

-
To calculate linear function value connect SequenceValues with inArray.
-
To calculate sine function create a new formula output:
Sine = sin(SequenceValues*180)
-
To calculate quadratical function create another formula output:
Quadratical = SequenceValues*SequenceValues
-
Calculation of the threshold function is more complicated. First, SequenceValues should be checked if its value is greater than 0.5. To do this, operator ?: should be used. The image below shows how to use this operator:

-
Add four RealArrayToProfile filters and connect their inputs to the formula's outputs (in case of the linear function take a look at point 3.).
-
Show output profiles in a single preview window.
Macrofilter Main is using formula to plot desired functions.

Further Readings
- Formulas - Detailed information about using formulas.


